
How to assess the quality of your data?
An experiment with Great Expectations
I was exploring options available on the market to assess the quality of datasets, with a fairly simple objective in mind: find a way to standardize the verification steps of data ingestion flows. But the more I searched, the more questions about governance came up. Who defines these business-specific rules? Where are they stored and documented? How can we make sure that the domain users have the possibility to state their own rules – with as little friction as possible for the engineer implementing them?
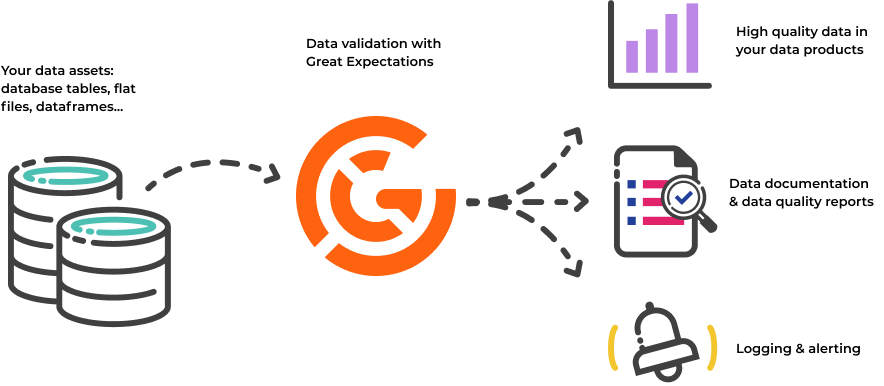
That’s in this context that I came across a tool named Great Expectations. A catchy name with an interesting idea behind it: the definition of expectations on your data. These are assertions expressed in a declarative language in the form of simple, human-readable Python methods.
# Expects the values in the column passenger_count to be between 1 and 6
# ... but a comment is not even needed here, the declaration of expectations feels natural :)
expect_column_values_to_be_between(
    column='passenger_count',
    min_value=1,
    max_value=6
)
Listed in a collaborative Expectations Gallery, everyone can create their own expectations and the proposals undergo a series of tests that classify them from experimental to production-ready.
The library then provides a structure to execute them, covering the full pipeline from discovery to production data validation. In this article I’ll walk through my first experiment with it, and then conclude on whether or not it met my initial needs. This will also be the opportunity to open a discussion on the concept of data as a product. If you don’t want to delve into techy details, you are allowed to jump straight to the conclusion.
The initialization
GX (Great Expectations) can be used in two distinct versions: open source or SaaS – as of today, the SaaS solution GX Cloud is still in free beta. Both offer integrations that fit most tech stacks, with the argument in favor of the latter being its ease of deployment and scaling. For now, we’ll simply install the great_expectations open-source Python package and give it a try. Our workflow will follow these four main steps.

GX holds the various elements we’ll work with in a Data Context, that is the equivalent of a “GX project”. It can be saved locally, in the cloud or just stay in memory. It’s quite handy as it limits the number of objects we have to manage to get the system running. It’s also the main entry point to the GX Python API.
Let’s configure a Data Context on disk.
import great_expectations as gx

CONTEXT_PARENT_FOLDER = r'C:\temp'
context = gx.data_context.FileDataContext.create(CONTEXT_PARENT_FOLDER)
This command created a folder structure with YAML and JSON files on my local drive, under C:\temp\great_expectations. It contains sub-folders for our expectations and checkpoints, which are concepts we’ll cover later, as well as other settings and metadata. A point to note here is that this is entirely customizable: we could create a common folder for shared expectations, and even push them to a source control system such as Git: by their very nature, these files generate perfectly usable diff outputs.
We can now start importing our data. For this experiment I decided to use a weather data set. It contains daily records of temperature, wind, sun and precipitations for almost all capitals in the world, and goes back to 1985. It’s an excellent candidate to test this library. On the one hand we have clear expectations of what weather measures should look like; on the other hand we might be surprised by unexpected events or a history of bad quality.
Our data comes in the shape of one CSV file per country, stored in C:\data\weather. Here is the code that connects to this folder using Python’s pandas library.
WEATHER_DATA_FOLDER = r'C:\data\weather'

# A datasource connector...
datasource = context.sources.add_or_update_pandas_filesystem('weather-folder', base_directory=WEATHER_DATA_FOLDER)

# ... accesses a data asset ...
asset = datasource.add_csv_asset('weather-asset', batching_regex=r'weather_(?P<country>[\w_]+).csv')

# .. to return batches of data
batch_request = asset.build_batch_request()

# Note: the asset can then be retrieved from the data context
# asset = context.get_datasource('weather-folder').get_asset('weather-asset')
As highlighted in the snippet, GX decided to split its data objects into 3 concepts: datasource, data asset and batch request. A datasource represents a connection using a specific engine, and allows to retrieve data assets, from which we can extract data using batch requests. In this example we rely on a regular expression to batch our data by file, i.e. by country.
At this point, GX knows where, how, and what to retrieve. On line 10, we compiled this information into a batch request that will be passed on to the next steps.
Let it discover a weather data set
Before going into deeper customization, I would like to try the Data Assistants proposed by the library. They are profilers running on datasets in order to determine expectations for us. Three types are at our disposal as of today:
- Onboarding discovers a data source from scratch and creates expectations using statistical methods such as mean and standard deviation. Also encompasses the other assistants below.
- Missingness creates expectations for non-null columns.
- Volume creates expectations on the volume of data in each batch.
While the first one might produce excessive results, the idea of automatically delegating missingness and volume checks to assistants is great. It saves time to the engineer and reduces human errors: instead of running ad-hoc queries on the source, these rules can be generated based on the actual shape of the data.
Here is what a call looks like on our dataset, including the most interesting subset of columns.
# Executes in ~4min
data_assistant_result = context.assistants.onboarding.run(
    batch_request=batch_request,
    include_column_names=['country', 'capital', 'date', 'season', 'avg_temp_c', 'min_temp_c', 'max_temp_c', 'precipitation_mm']
)

# To visualize the result in an interactive environment such as a Jupyter Notebook
data_assistant_result.plot_expectations_and_metrics()
This onboarding assistant offers a lot of insights – generating no less than 52 expectations! Cool features of GX allow us to plot them and get a very clear and visual understanding of the result. Here are some examples.
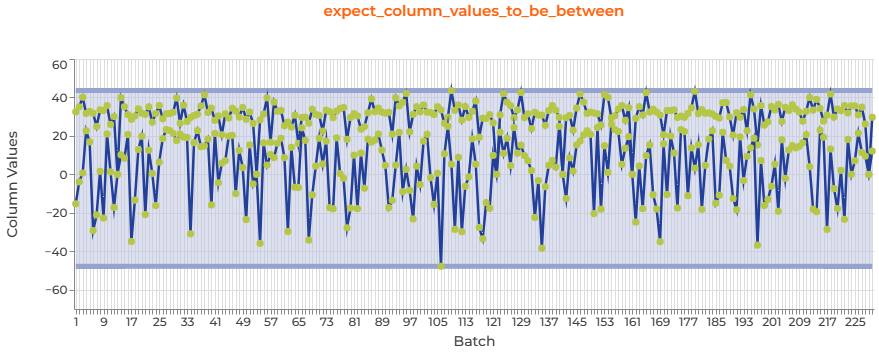
This first expectation is set on the average temperature. It expects that the column values stay between the minimum and the maximum observed in all the batches so far. You can see that it spans from less than -40 to more than 40, which seem to be consistent values. Some countries are more extreme than others, and this is well reflected in the difference between the data points, producing this fuzzy chart.
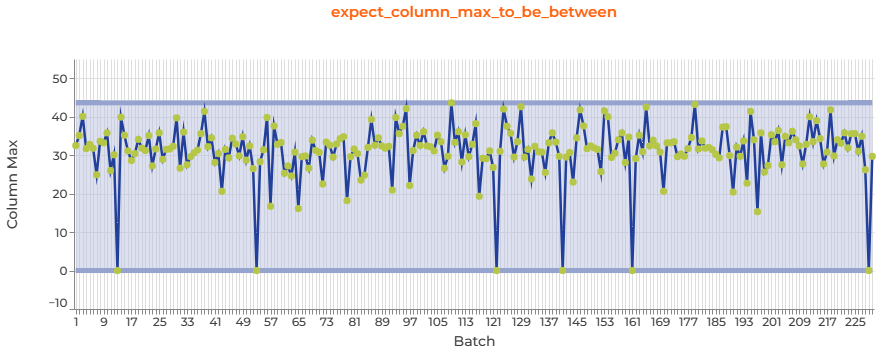
Still on the average temperature – but this time the expectation is on the range within which the maximum of that column should fall. It reveals a pattern that was invisible in the previous chart: some countries have a maximum average temperature of 0°C. This is certainly due the fact that this measure is not reported at all for them. Therefore, if we want to raise these cases as problems in the future, we would need to adjust this automatic expectation by increasing the lower bound of the range: something the onboarding assistant didn’t take the risk of doing.
There are plenty of other cases created for us to analyze: standard deviation, median, quantiles, unique values, … Some of them are also at a table level – such as expect_table_columns_to_match_set, which validates the schema of our set. I would say that I’m happy with the result and definitely think that some of the outputs can be reused, after proper analysis and confirmation of their relevance. The next step would be the save these into expectation suites and run them with checkpoints.
Creating expectations based on domain knowledge
Now I want to tackle the problem the opposite way. What if I know exactly what to expect from my data – but can’t access it? GX offers a way to create expectations without a sample batch. There are several reasons why we might want to do this:
- We don’t have a sample.
- We don’t currently have access to the data to make a sample.
- We know exactly how we want our expectations to be configured.
- We want to create expectations parametrically (we can also do this in interactive mode).
- We don’t want to spend the time to validate against a sample.
To do so, we must define the expectations in a format matching the JSON file stored in the Data Context.
from great_expectations.core.expectation_configuration import ExpectationConfiguration

# Create a new expectation suite
suite = context.add_or_update_expectation_suite(expectation_suite_name="weather-domain-expectations")

# Add expectations from static configuration
suite.add_expectation(ExpectationConfiguration(
    expectation_type='expect_column_values_to_be_in_set',
    kwargs={
        'column': 'season',
        'value_set': ['winter', 'spring', 'summer', 'autumn']
    }
))

suite.add_expectation(ExpectationConfiguration(
    expectation_type='expect_column_pair_values_a_to_be_greater_than_b',
    kwargs={
        'column_A': 'max_temp_c',
        'column_B': 'min_temp_c',
        'or_equal': True
    },
    meta={
        'notes': {
            'format': 'markdown',
            'content': 'Expects that the **maximum** temperature is greater or equal to the **minimum** temperature of a record'
        }
    }
))

# Save the expectation suite into the Data Context, for future use
context.save_expectation_suite(suite)
Here we declare two domain expectations. As a reminder, the idea is to identify standards to which our data should conform.
The first one expects to see four distinct values in the season column, corresponding to the four season names. The second one expects, for each line, the maximum recorded temperature to be greater than the minimum temperature. A failure to meet either of these would indicate that the dataset is somewhat erroneous. I also added a meta section, which allows to write markdown-formatted notes, a convenient place to document the business rule behind the expectation – as close as possible to the logic itself! Our expectation suite is ready and saved back to the data context.
To run the rules we just created and see if the weather measures conform, we’ll need the concept of checkpoint. A checkpoint bundles the validations of a batch of data (using a batch request) against an expectation suite; it is a reusable component that we could trigger on a schedule to perform validations of new data.
# Create a checkpoint that will validate our expectation suite against all batches of data
# We loop through the batches to generate every single validation performed by the checkpoint
batches = asset.get_batch_list_from_batch_request(batch_request)
validations = []
for i in range(len(batches)):
    validations.append({
        'batch_request': asset.build_batch_request(batch_slice=f'[{i}]'),
        'expectation_suite_name': 'weather-domain-expectations'
    })

checkpoint = context.add_or_update_checkpoint(
    name='weather-domain-checkpoint',
    validations=validations,
)

# Note: the checkpoint can then be retrieved from the data context
# checkpoint = context.get_checkpoint('weather-domain-checkpoint')

# Run it and retrieve the result
checkpoint_result = checkpoint.run()
This execution returned detailed results by expectations. As a whole, the checkpoint validation failed. I could investigate by looking at the JSON result directly, or by generating a web view called “Data Docs”. Let’s try the second option.
# Running this interactively opens a new "Data Docs" website generated by GX
context.build_data_docs()
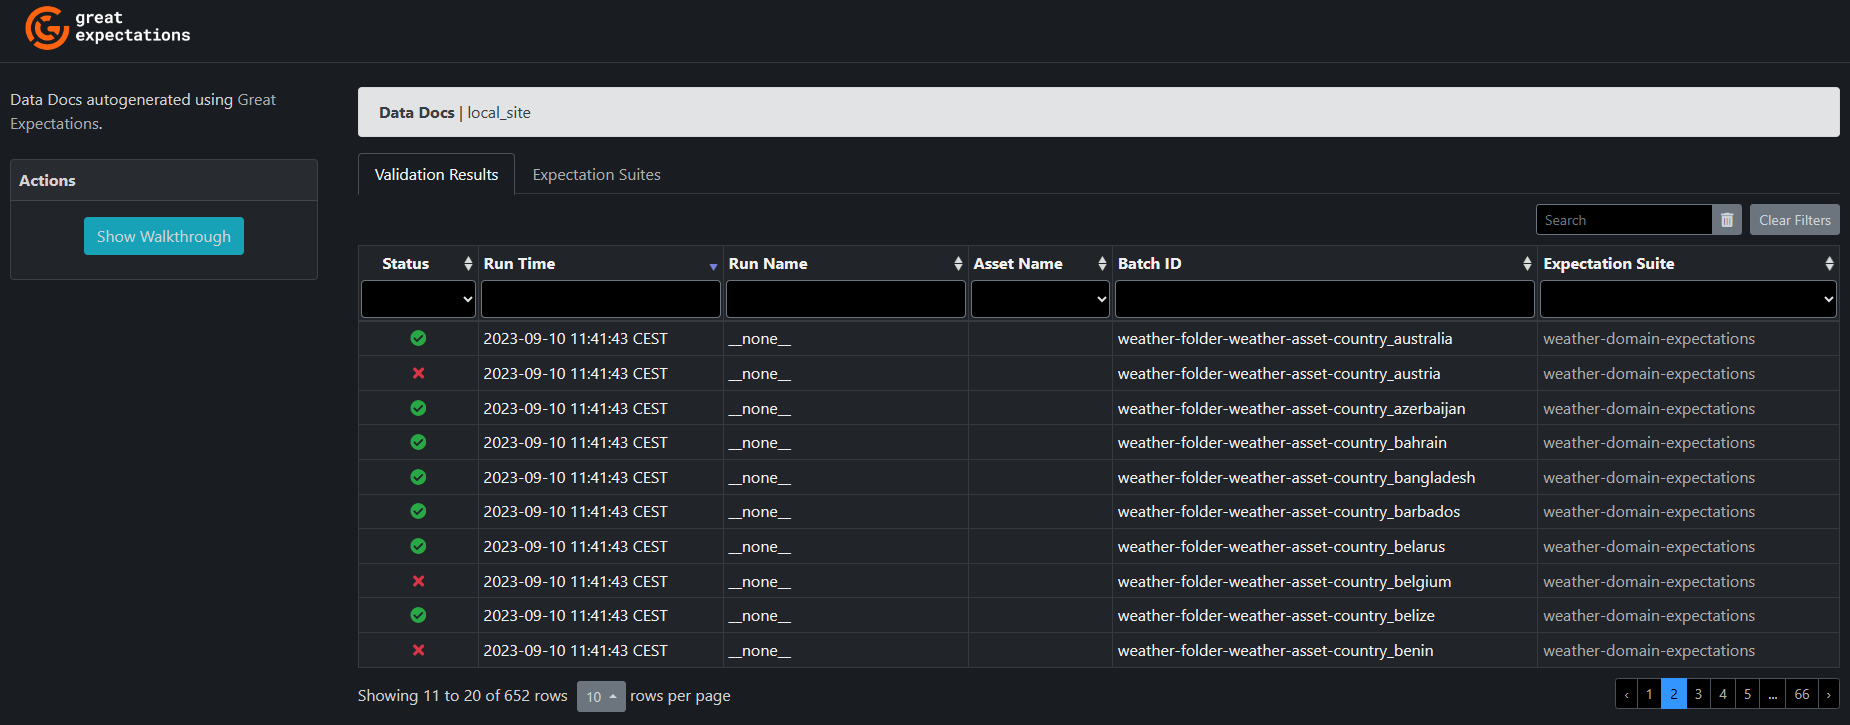
context.open_data_docs()The website presents all the validations executed, and their status. Most countries passed the test, but some surprisingly didn’t.
Clicking on a specific validation run expands its details in a new page. And a well-thought feature: it shows you a sample of the unexpected values that failed the test! This can save a lot of debugging headache. Among these details, a table helps us understand the problem.
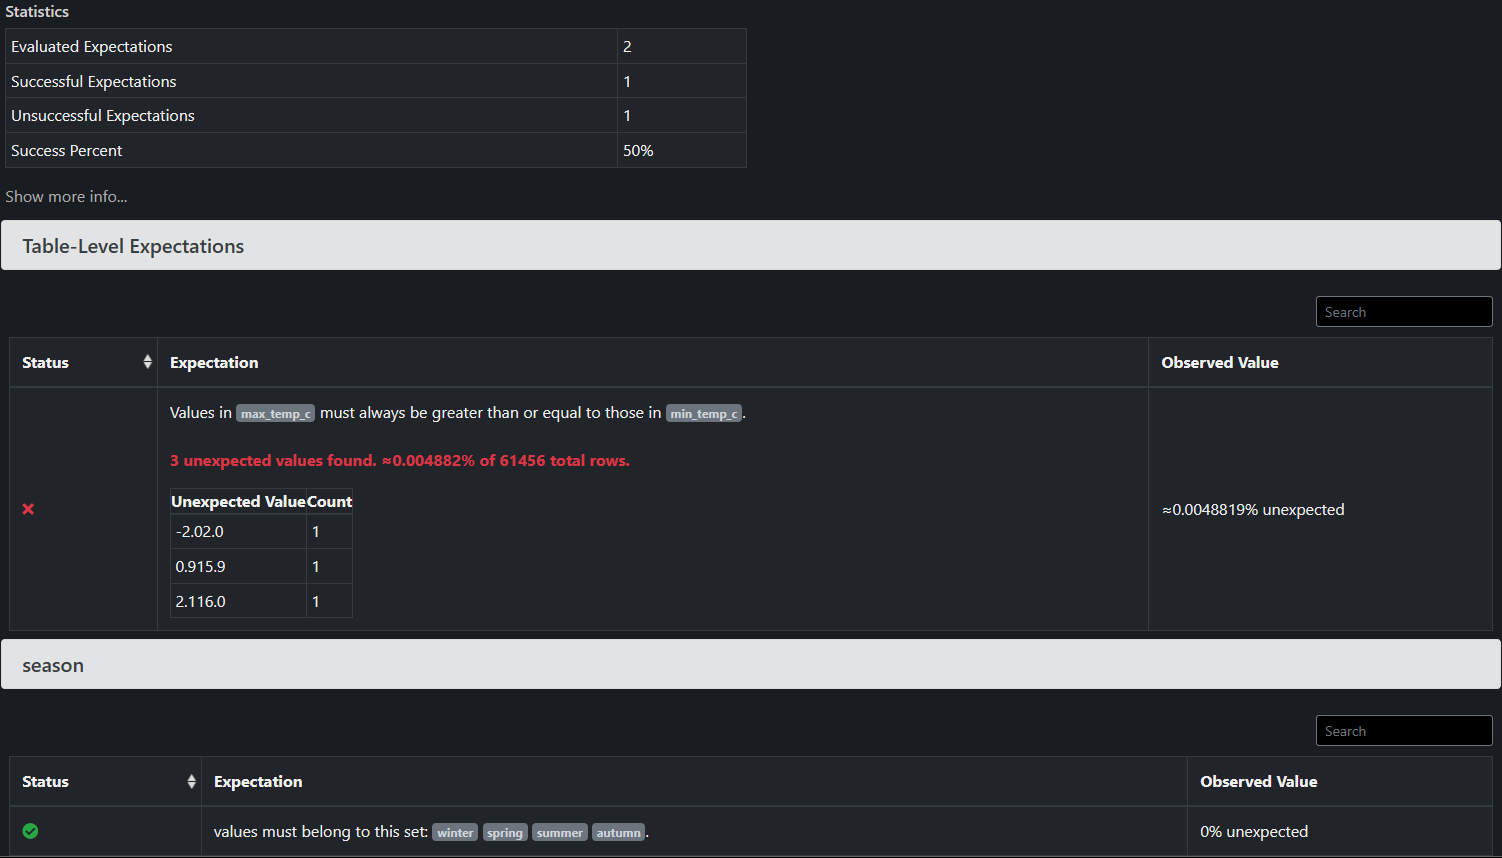
In this example, a country does indeed have wrong records where the maximum temperature is lower than the minimum temperature… But as the statistics show, this problem only affects a minor number of records: less than 0.01% of them.
Conclusion: how would it perform in the real world?
In this brief experiment we covered how to define expectations with GX, either with domain knowledge alone or with the characteristic (positive!) laziness of a developer who relies on computer-assisted methods. We then observed on the surface the notion of checkpoint for validation, by configuring and executing one. There is definitely a lot more to be said on the possible workflows this enables: for example a checkpoint can go beyond yielding a result and trigger actions. A feature that proves useful to remedy a discovered problem: what do we do when our expectations are not met? We could send an email notification to an operating support team, display it into data lineage systems, and/or update the Data Docs website automatically with the new results.
But I’d like to highlight how crucial this question is: what do we do when our expectations are not met? Problems can occur all along the value chain, and an adequate governance is of the utmost importance to ensure confidence in top-grade, timely data. When working with data as a product, it’s important to apply a quality label on it and keep our promises. I believe that Great Expectations does a good job in offering tools that allow to define and track these standards, plus having a shared understanding of them with the business users.
GX also represents an excellent candidate to capture the notion of data contract deep into the technical layers.
- Checkpoints are codified versions of your data contract description.
- Each run verifies whether the contract is being upheld.
- The Data Docs makes the results accessible to data developers and nontechnical professionals alike.
- The contract can be further enforced by configuring automated actions.
Its workflow components and their human-readable notations help assign the right responsibility to the right people. They are flexible enough to be plugged together in various ways and fit unique organizations structures, while providing a unified language for everyone. Expectations definition could even be delegated to the domain users directly, thus relieving the data engineer of that task.
As a closing comment, I would definitely be interested in working further with GX, to explore the extent to which expectations and components can be reused, and to define a methodology for onboarding new datasets.
Thomas